19. Results of individual studies
For all outcomes, present for each study (a) summary statistics for each group (where appropriate) and (b) an effect estimate and its precision (such as confidence/credible interval), ideally using structured tables or plots
Essential elements
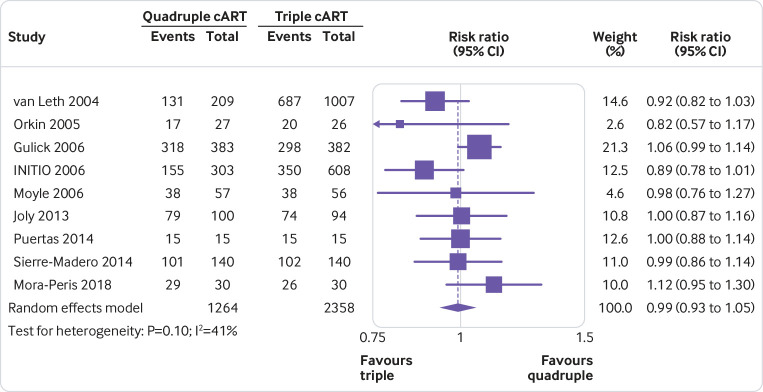
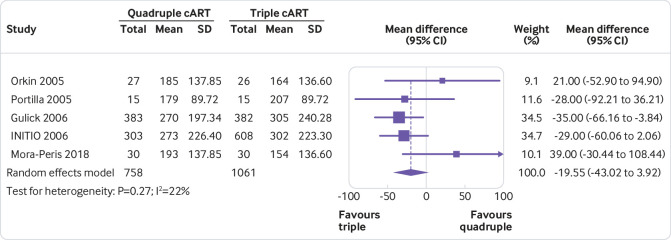
For all outcomes, irrespective of whether statistical synthesis was undertaken, present for each study summary statistics for each group (where appropriate). For dichotomous outcomes, report the number of participants with and without the events for each group; or the number with the event and the total for each group (such as 12/45). For continuous outcomes, report the mean, standard deviation, and sample size of each group.
For all outcomes, irrespective of whether statistical synthesis was undertaken, present for each study an effect estimate and its precision (such as standard error or 95% confidence/credible interval). For example, for time-to-event outcomes, present a hazard ratio and its confidence interval.
If study-level data are presented visually or reported in the text (or both), also present a tabular display of the results.
If results were obtained from multiple sources (such as journal article, study register entry, clinical study report, correspondence with authors), report the source of the data. This need not be overly burdensome. For example, a statement indicating that, unless otherwise specified, all data came from the primary reference for each included study would suffice. Alternatively, this could be achieved by, for example, presenting the origin of each data point in footnotes, in a column of the data table, or as a hyperlink to relevant text highlighted in reports (such as using SRDR Data Abstraction Assistant1).
If applicable, indicate which results were not reported directly and had to be computed or estimated from other information (see item #13b).
Explanation
Presenting data from individual studies facilitates understanding of each study’s contribution to the findings and reuse of the data by others seeking to perform additional analyses or perform an update of the review. There are different ways of presenting results of individual studies (such as table, forest plot).23 Visual display of results supports interpretation by readers, while tabulation of the results makes it easier for others to reuse the data.
Displaying summary statistics by group is helpful, because it allows an assessment of the severity of the problem in the studies (such as level of depression symptoms), which is not available from between-group results (that is, effect estimates).4 However, there are some scenarios where presentation of simple summary statistics for each group may be misleading. For example, in the case of cluster-randomised designs, the observed number of events and sample size in each group does not reflect the effective sample size (that is, the sample size adjusted for correlation among observations). However, providing the estimated proportion of events (or another summary statistic) per group will be helpful.5 The effect estimates from models that appropriately adjust for clustering (and other design features) should be reported and included in the meta-analysis in such instances.
Example
For an example of individual study results presented for a dichotomous outcome, see Figure 1. For an example of individual study results presented for a continuous outcome, see Figure 2.6


Training
The UK EQUATOR Centre runs training on how to write using reporting guidelines.
Discuss this item
Visit this items’ discussion page to ask questions and give feedback.