9 Defining intervention components and developing a prototype
9.1 Introduction
In this chapter I describe how I brought together the outputs of all previous research chapters to create an intervention planning table containing intervention components. I then describe how I turned this table into a working prototype ready to be tested by authors.
In chapters 3 - 5 I described how I identified influences affecting whether authors adhere to reporting guidelines. In chapter 7 I described how ran workshops with reporting guideline experts at the UK EQUATOR Centre to define a target behaviour, consolidate influences, prioritise intervention functions and policy categories, and how I decided to prioritise redesigning reporting guidelines and the EQUATOR Network’s website hope page. In chapter 8 I described how I asked guideline developers, publishers, and other stakeholders to build upon our workshop outputs by brainstorming solutions to barriers.
Consequently, at this point in my thesis I had multiple lists; a list of influences, lists of intervention options, and a list of ideas. Not all ideas were relevant to the EQUATOR Network or aligned with our prioritised intervention options, and although ideas referenced influences, the links between ideas, influences, intervention functions, and behaviour change techniques were not fully explicit.
What remained was to select ideas I could implement, define them as intervention components, then build a prototype I could test with authors. Michie et al. [1] define an intervention component as:
- a designed element that uses one or more behaviour change technique,
- theorized to work through one or more intervention functions
- to target one or more behavioural drivers.
Michie et al. [1] describe this step as “identify[ing] intervention content in terms of which [behaviour change techniques] best serve intervention functions”, where a behaviour change technique is “an active component” that is “observable, replicable, [and] irreducible”. Defining intervention content in this way is useful because it helps intervention developers understand why the component was added (or removed), how it is theorised to work, and how its effectiveness may be tested.
Once defined, I wanted to turn this list of intervention components into a prototype that could be tested by authors. This prototype would have to include a) a redesigned reporting guideline and b) a redesigned version of the EQUATOR Network home page that testers could navigate to find the redesigned reporting guideline. I wanted the prototype to be real enough so testers could use it as they would a real website. This meant I had to make decisions about content, design, and also the underlying software used to create and host the website.
I wanted to include EQUATOR staff and guideline developers in the redesign process for three reasons. Firstly, because EQUATOR staff will need to take responsibility of what I build if it is to be successful, the underlying architecture must be easy for them to understand and maintain and affordable to run without funding. Secondly, I expected their experience and expertise to help decision making and by prioritising their opinions I hoped to keep my own subjectivity in check. Thirdly, I wanted to ensure they understood the intervention and felt like it was “ours” not “mine”.
I decided to focus on redesigning one reporting guideline instead of many: the Standards for Reporting Qualitative Research (SRQR). Focussing on one guideline meant I could work alongside its creators to fully understand its nuances and allowed me spend time on design rather than repeatedly applying a design to multiple guidelines (even a simple design choice – like how to format an item – takes time to apply, and this time multiples with more guidelines). I chose SRQR because I was familiar with it, understood it, and it’s lead developer expressed interest in collaborating. Additionally, because it is applicable to all medical qualitative research I expected its users to be plentiful and varied. For example, authors may include students, clinicians, public health experts, quantitative researchers dabbling in qualitative methods within a positivist framework, or experienced qualitative researchers working within other paradigms. This broad and varied author base would be useful for a subsequent qualitative feedback study (see next chapter).
In summary, the aim of this chapter was to create an intervention in preparation for a subsequent qualitative user feedback study. My objectives were to:
- Create a list of intervention components by combining the outputs of previous chapters.
- Redesign the EQUATOR Network home page and SRQR guideline.
9.2 Methods
Defining intervention components
I started the 128 ungrouped ideas originating from my focus groups (chapter 8). I then cross-checked the list of favoured behaviour change techniques (from step 7 of chapter 8) with the list of influences (from step 4) to ensure I had considered all options. This sparked 8 more ideas (see Appendix O), bringing my starting list to 136 ideas.
I labelled each idea with:
- The influence(s) it addresses (derived from chapters 3, 4, 5, and step 4 of chapter 7).
- The behavioural driver it targets (from step four of chapter 7).
- The intervention functions it uses.
- The behaviour change techniques it uses, selected from Michie et al.’s taxonomy [2].
I asked a colleague with experience in behaviour change taxonomies to double check my coding, and we resolved disagreements through discussion.
For each idea, I then considered:
- Whether it was implementable by redesigning guidelines or by modifying the EQUATOR website. If not, I removed it from the list.
- Whether its intervention function aligned with the intervention options EQUATOR and I had prioritised during our workshops (see workshop steps 5 & 6 in chapter 7). If not, I removed it from the list.
To give structure to this list, I grouped intervention components according to the sub-behaviours they targeted: 1) engaging with guidance and 2) applying it (see section on specifying the target behaviour in chapter 7). To provide extra context and clarity, I described each component in more detail and how it compares to the status quo. In doing these comparisons I made generalisations about how popular reporting guidelines are written and disseminated by drawing on evidence from my qualitative synthesis (3), looking at how the EQUATOR website is currently, and referring back to workshop discussions (from chapter 7).
Redesigning the SRQR reporting guideline and EQUATOR Network home page
Co-design meetings and process
Throughout the creation process I drew on the principles of co-design: “active collaboration between stakeholders in the design of solutions to a pre-specified problem” [3]. In this chapter I describe how I worked alongside SRQR’s lead developer and reporting guideline experts from the UK EQUATOR Centre, and in the next chapter I describe how I continued these principles by seeking feedback from authors. I invited the EQUATOR staff who participated in the workshops (chapter 7) to form a design advisory group. The group and I met three times between November 2022 and January 2023. In our first meeting, we decided how the home page and redesigned guideline should join and whether any interim pages were required.
In our second meeting, the design advisory group and I sketched ideas for how the home page and reporting guideline page could be laid out and for the positioning of intervention components. These sketches were wireframes: simple illustrations focussing on space allocation, functionalities, and intended behaviours. Wireframes do not include styling. They have no colours, images are represented as blank boxes, and lines represent blocks of text.
After the second meeting, once participants had agreed on a layout, I created an alpha version of the new home page and guideline page. These were real webpages, viewable in a browser, but I used dummy text and images because I wanted to solicit feedback on layout, structure, and functionality, not on the content. This is a common practice in web development, as people can become distracted by wording or stylistic choices. I used a web annotation tool called Pastel to collect feedback from the design advisory group [4] and then refined the alpha version based on this feedback.
In our third meeting, we co-created text for the home page. We began by listing the intervention components the text needed to address. The text needed to explain what reporting guidelines were, how they can be used, and the benefits they bring to authors. The design advisory group drafted text on their own before discussing and editing as a group. We also discussed style and imagery in this meeting. Again, we began by listing the intervention components the images needed to address. These included communicating what reporting guidelines are, who should use them, communicating simplicity and confidence. I invited design group members to contribute websites and images they admired for inspiration. We ended up discussing websites run by the National Health Service [5], the International Organisation for Standardisation [6], and the National Institute for Health and Care Excellence (NICE) [7]. We looked through examples of free-to-use images from a number of libraries [8–11]. I also consulted usability best-practices [12] and NICE’s style guide for guideline developers [13]. I then populated the alpha version with the text and images discussed in this meeting.
After the third meeting I began redesigning the SRQR guideline. I got written permission from SRQR’s publisher (the Association of American Medical Colleges) and lead developer, Bridget O’Brien. I began redesigning SRQR by pasting the text from SRQR’s Explanations and Examples supplement [14] into Microsoft Word and rearranging item content into categories identified in chapter 8 (see Appendix O Describe reporting items fully): what to write, how/where to write it, what to write if the item was not/could not be done, why the item is important and to whom, and examples. I edited sentences to speak directly to authors and to use active voice, e.g., “Describe X” instead of “X should be described”. This shortened the text and made it clearer that the primary audience is authors.
For composite items I split the sub-items into bulleted lists. E.g.
For each X, describe:
- A
- B
- C
I rearranged conditional sub-items to read as “If X, then describe Y”, instead of “Describe Y if X”. I moved definitions into a glossary and contextual information into notes. I edited the tone of voice to add reassuring language. I asked SRQR’s developer to provide feedback on the redesigned guideline and made refinements based on her comments.
After development, I double checked the intervention against my intervention planning table (see chapter 9) to ensure I had included all components. I invited another round of feedback from the design advisory group and made more refinements.
Trustworthiness
As before, I used established, best-practice techniques to facilitate open discussion in the design meetings [15]. I made it clear there were no right or wrong answers. I reflected on my own opinions before meeting, and held them back until the design advisory group had finished talking. When disagreements arose, I took time to explore and understand both sides.
I made heavy use of my intervention planning table (see chapter 9) to make decisions based on theory over and above personal preferences. Instead of asking EQUATOR members whether they liked something (e.g., Do you like this font?), I asked whether they felt it reflected the intended intervention function instead (e.g., Does the font convey simplicity?). By prioritising theory above preference, and others’ opinions above my own, I reduced my subjectivity.
Target audience
Throughout our meetings we kept our target audience in mind. Building user personas is a common best practice in web development [16–18]. For example, as part of their work to help NHS staff adopt new technologies and become a digital workforce, Health Education England identified archetypes: digital creators, end users, embedders, change drivers, and shapers [19]. They then developed imaginary personas around these archetypes, each with their own needs, motivations, and challenges. Developing personas can be a significant task. Some product teams go as far as interviewing 5 or more representatives of each persona in an iterative, co-creation process. This was not feasible within my DPhil and so my persona generation process was less formal but still evidence based. Referring to my website service evaluation (chapter 5), I recalled most website visitors are new and visit only once, and so I inferred many will be naïve to reporting guidelines and the EQUATOR Network. Website visitors come from all over the world, so I assumed some may speak English as a second language (or not at all). I had no way of knowing how much research experience EQUATOR’s website visitors have, but I assumed the distribution would reflect real-world numbers, where students and early career researchers outnumber experienced professors. Although the EQUATOR website has content aimed at editors, librarians, and guideline developers, this content is rarely accessed and these users are not part of my target behaviour (see chapter 7), and so I did not create personas for them.
Consequently, two personas crystallised in my mind: inexperienced and experienced authors.
- Inexperienced author:
- may not be familiar with EQUATOR or reporting guidelines
- may find authoring / publishing difficult
- may need help in finding, understanding, and applying a reporting guideline
- if English is their second language, they may be less proficient in reading/writing in it
- Experienced author:
- may be familiar with EQUATOR and/or reporting guidelines
- may have used checklists before, but may not realise full guidance exists, and may have never used reporting guidelines for drafting.
- may feel patronized or restricted by reporting guidelines, especially if they believe them to be design requirements
- may see checklists as red tape necessary for publication, or they may be reporting guideline “converts” already convinced of their value.
Many authors may fall somewhere between these two personas. In discussion with the design advisory group, I decided to prioritise inexperienced authors because I believed them to be more numerous, and because qualitative evidence suggests inexperienced authors may benefit more from reporting guidelines but experience more barriers when using them (see chapter 3). By focussing on helping inexperienced authors, I hoped any spill-over effects may also help experienced authors.
User personas typically include motivations. There is an important difference between user motivations - what authors are wanting to do when they visit EQUATOR’s website - and our target behaviour - what we want authors to do when they visit EQUATOR’s website. Because most visitors come from journal websites or submission systems and because checklists are the most accessed resourced (chapter 5), I assumed most authors visit the website because they want to fill out a reporting checklist as part of journal submission. In contrast, my target behaviour specifies authors should read the full reporting guidelines as early as possible, i.e., when planning or drafting research, way before they submit to a journal. I could have designed a website to focus entirely on drafting manuscripts, but this would have abandoned authors seeking checklists. Instead, I took a more pragmatic approach and decided to continue catering for authors seeking checklists, but to nudge them towards using the full guidance for drafting research in the future.
Making decisions about system architecture
When considering architecture options I spoke to the UK EQUATOR Centre and University departmental staff members about financial constraints, data security concerns, and to understand what website building tools and technologies they felt comfortable with. I then looked at the designs we had created on paper, considered the functionality those designs would require, and selected architecture options to support those functions.
9.3 Results
Intervention components
From the initial list of 136 ideas I identified 62 intervention components that could be implemented by redesigning guidelines and by improving the EQUATOR Network home page. Together, these components use 17 behaviour change techniques and 6 intervention functions to target 32 influences. Of these 62 intervention components I managed to include 46 when redesigning SRQR and EQUATOR’s home page. The remainder were not feasible.
The full intervention component table is long and disrupted the narrative of this chapter, and so I moved it to Appendix P. In this chapter I’ve included shorter tables for each intervention part, and summarised included components labelled with their intervention function and employed behaviour change technique. I’ll now go through parts of the design and summarize the components in each.
Intervention description
Site organisation and search
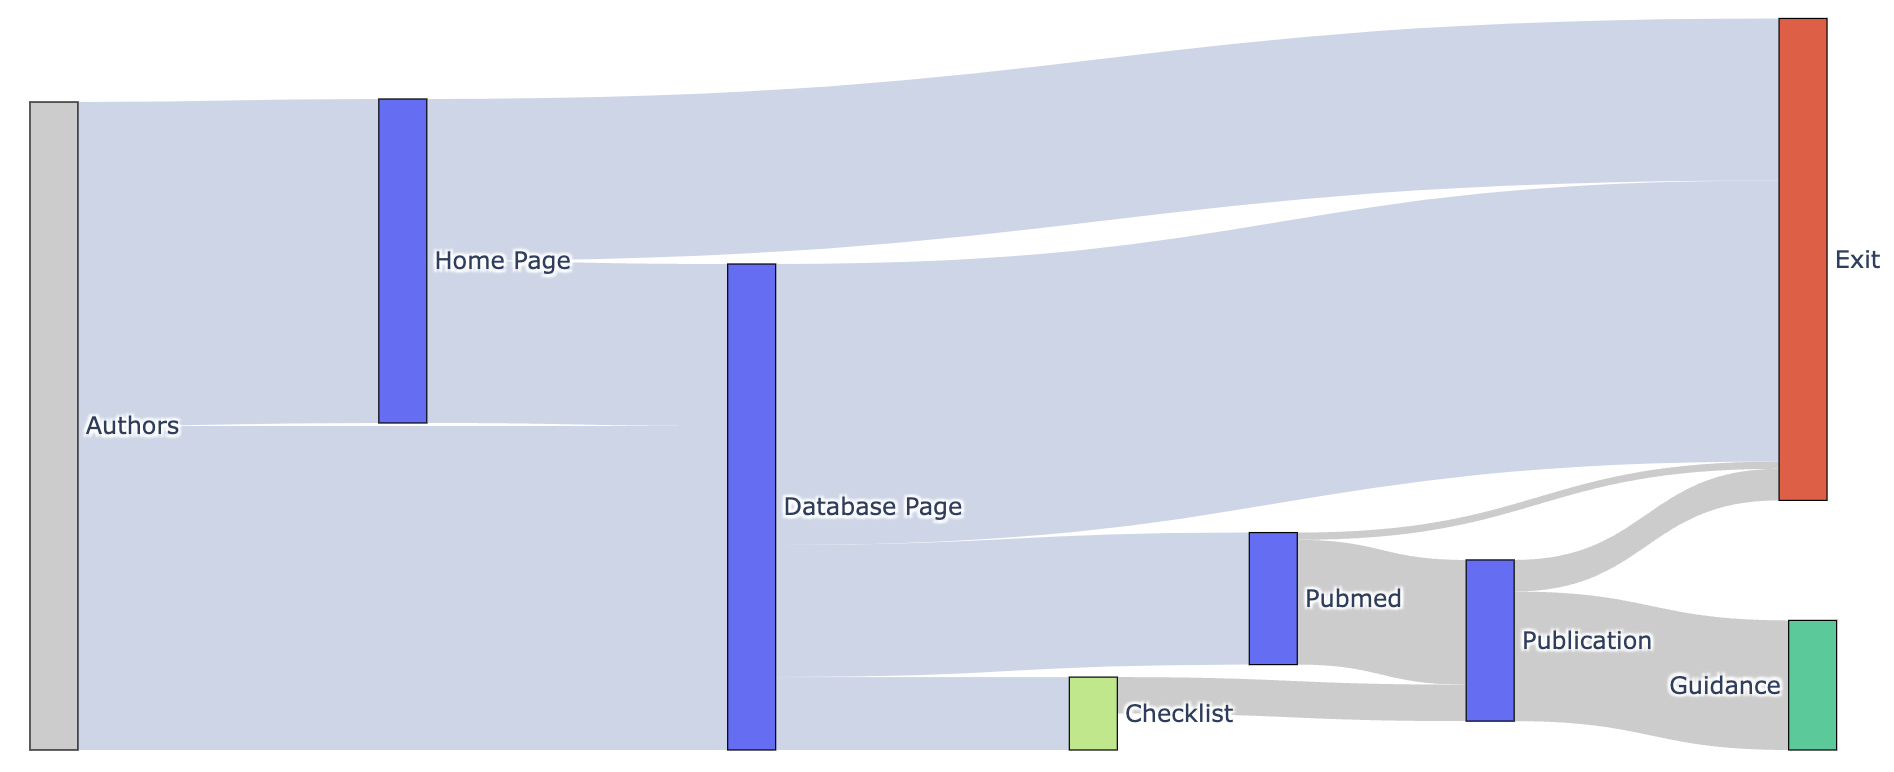
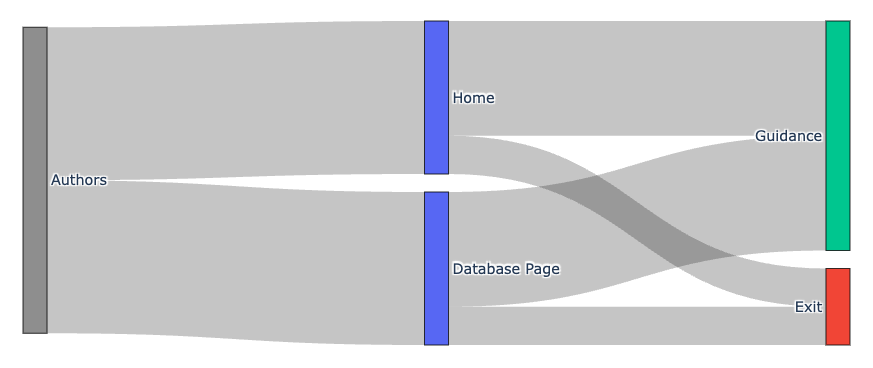
Some intervention components required considering how authors would navigate and search the website (see Table 9.1). My first meeting with the design advisory group focussed on how the redesigned home page and guideline should link, and whether we needed any steps in between the two. On EQUATOR’s existing website, authors starting on the home page must navigate through 5 webpages to reach the full reporting guidance; the home page, guideline database page, PubMed, a publication, and then sometimes a supplement. From my website service evaluation (chapter 5), we knew many authors leave at each step (see Figure 9.1). Therefore, we wanted our redesigned home page to link directly to the most frequently used guidelines, thereby reducing this this journey to 2 steps, with the aim to increase the proportion of authors reaching the full guidance (see Figure 9.2).
We also decided to display the full guidance texts on the website whenever licences allow. Currently, EQUATOR’s website directs authors to different publishers and guideline development group websites. Sometimes the full guidance is published as a supplementary material, and checklists can appear as supplements, tables, or figures. Bringing the full guidance texts to a single website makes them easier to find, means we can ensure all have a consistent, usable format, and allows us to track authors behaviour. But this is only possible when guidance is published under a permissible licence.
When discussing how authors would navigate the website, we decided to cater to both users that search and users that browse. The website features a search function adhering to user experience norms (the search button on EQUATOR’s original website is difficult to find), and each web page has enhanced meta data to optimise search engine performance. To help browsing authors, we decided to ensure all related guidelines and resources link to each other. Previously, guidelines rarely linked to each other, and checklists rarely linked to full guidance. In the redesign, guidelines link to related guidelines, and all resources link to each other. In the future, EQUATOR may consider creating collections of related guidelines (e.g., a page featuring all guidelines relating to a study design, health condition, or theme), decision aid tools, or may embed related guidelines (e.g., PRISMA for Abstracts could be embedded within PRISMA).
| INTERVENTION COMPONENT | INTERVENTION FUNCTION | BCT |
|---|---|---|
| Centralised hosting | Enablement | Restructuring the physical environment |
| Search function on website | Enablement | Restructuring the physical environment |
| Links between related guidelines | Environmental Restructuring | Restructuring the physical environment |
| Search Engine Optimization | Enablement | Restructuring the physical environment |
| link all resources to each other | Environmental restructuring | Restructuring the physical environment |
Intervention components that occur throughout
Some intervention components pervaded all parts of the redesign (see Table 9.2). These components centred on three themes: our target audience, nudging authors towards using guidelines earlier in their writing, and positioning reporting guidelines as helpful rather than administrative.
In the methods section I described how EQUATOR and I decided that our primary audience was authors (not editors, reviewers etc.), and inexperienced authors in particular. In my thematic synthesis (chapter 3) I found some authors felt reporting checklists were the responsibility of an editor or peer reviewer. In part, this might be because some reporting guidelines are written passively (“Reports should describe…” etc.). In contrast, my design speaks directly to the author (“When writing up your research…” etc.), and I used terminology with inexperienced authors in mind.
Many components nudge authors towards using reporting guidelines early in their writing. For instance, the first text authors see mentions “writing up” and the guideline text is worded from the perspective of writing (as opposed to checking or reviewing). The home page and guideline page explicitly describe stages of writing where reporting guidelines can be used. The website layout forces authors to access the full guidance before the checklist, and the checklist button is positioned after the button for a template that can be used when drafting. The meta-data for search engines includes terms like “how to write” or “describe” so the pages appears in search engine results when authors search queries like ‘how to write up an epidemiology study’. In contrast, my thematic synthesis revealed that some authors may currently think reporting guidelines are checklists, and are meant to be used as part of journal submission. This is, after all, how most authors discover them and few guidelines contain any instruction to the contrary.
Finally, because my thematic synthesis found some authors describe reporting guidelines as administrative red-tape, I wanted to position reporting guidelines as trusted resources that will help, not hinder, researchers. I did this by creating content and an aesthetic that would foster trust and convey two personal benefits of using reporting guidelines: simplicity and confidence. I created this aesthetic by using a simple colour scheme with plenty of negative space. I tried to keep the tone of voice professional but simple and empowering. I avoided design or language that may invoke feelings of judgement, complexity, or administration. I tried to keep language concise and clear without being patronizing.
| INTERVENTION COMPONENT | INTERVENTION FUNCTION | BCT |
|---|---|---|
| Remove branding and messaging that may invoke feelings of judgement, complexity, or administrative red-tape | Coercion (Removal of) | Remove aversive stimulus |
| Include design, features, and language to foster trust | Persuasion | Credible source, Social comparison |
| Use tone of voice and design to communicate personal benefits; confidence and simplicity | Persuasion | Framing/reframing |
| Avoid patronizing language | Persuasion | Remove aversive stimulus |
| Address communications to authors | Education | Instruction on how to perform a behaviour |
| Reassure that all research has limitations to encourage explanation over perfect design | Persuasion | Social support (unspecified) |
Home page
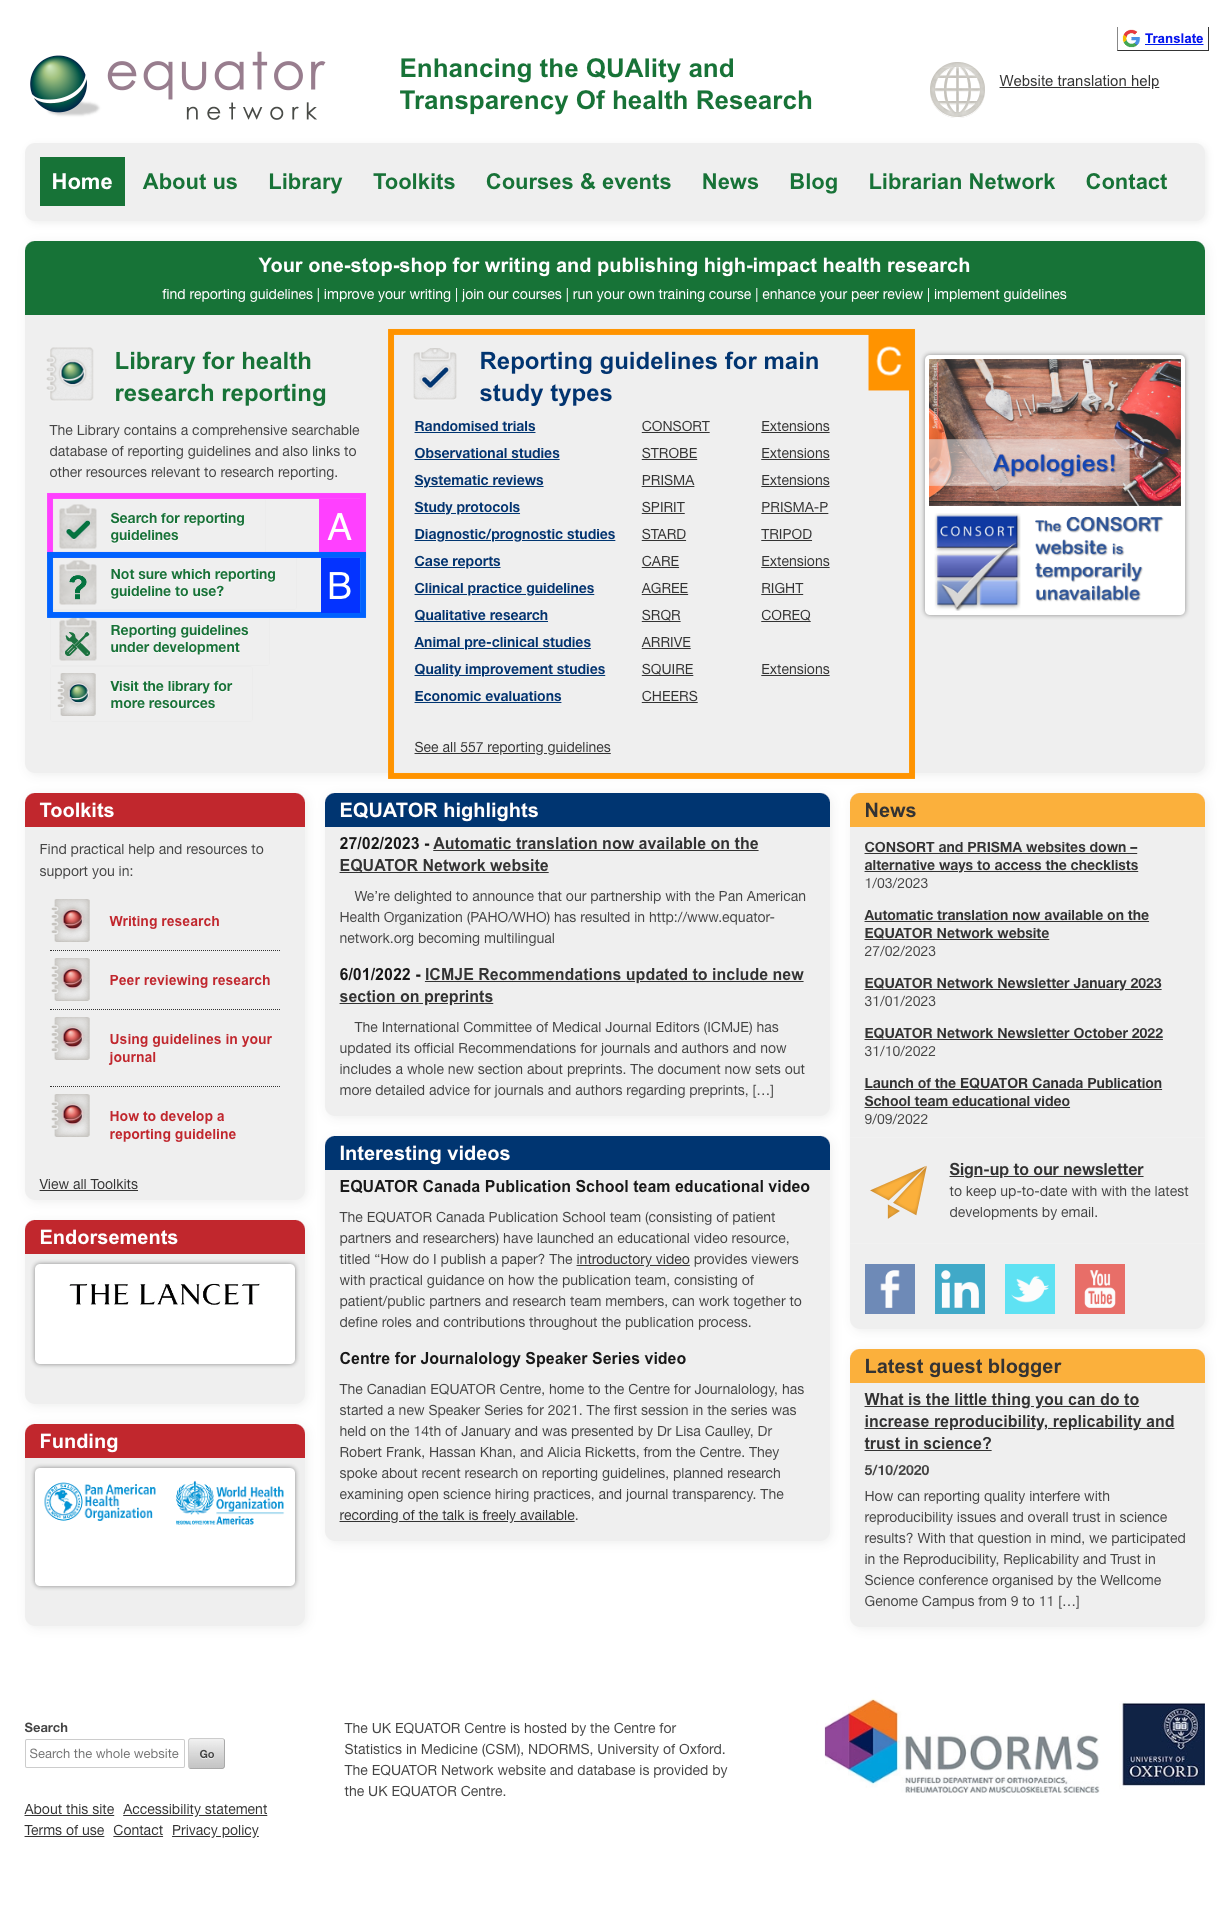
EQUATOR’s current home page (see Figure 9.3) does not define what reporting guidelines are, or how or why to use them. Although it is full of content, the overall impression is one of complexity with no clear message. Intervention components appearing on the home page are listed in Table 9.3. Its limitations include:
- No prominent description of what reporting guidelines are
- No clear instruction on what tasks reporting guidelines can and cannot be used for
- Search function hard to find (area A)
- Decision tool for identifying which reporting guideline to use was hard to find (area B)
- The page looked cluttered and unappealing
- The tone of voice was functional. It was not particularly judgemental but not reassuring either.
- There was little description of benefits of using a reporting guideline besides the mention of ‘quality’ and ‘transparency’ in the definition of EQUATOR, reference to ‘high-impact research’, ‘improve your writing’, and ‘enhance your peer review’ in the header.
- No reassurance that most research has limitations
- Frequently accessed guidelines are fairly easy to find (area C).
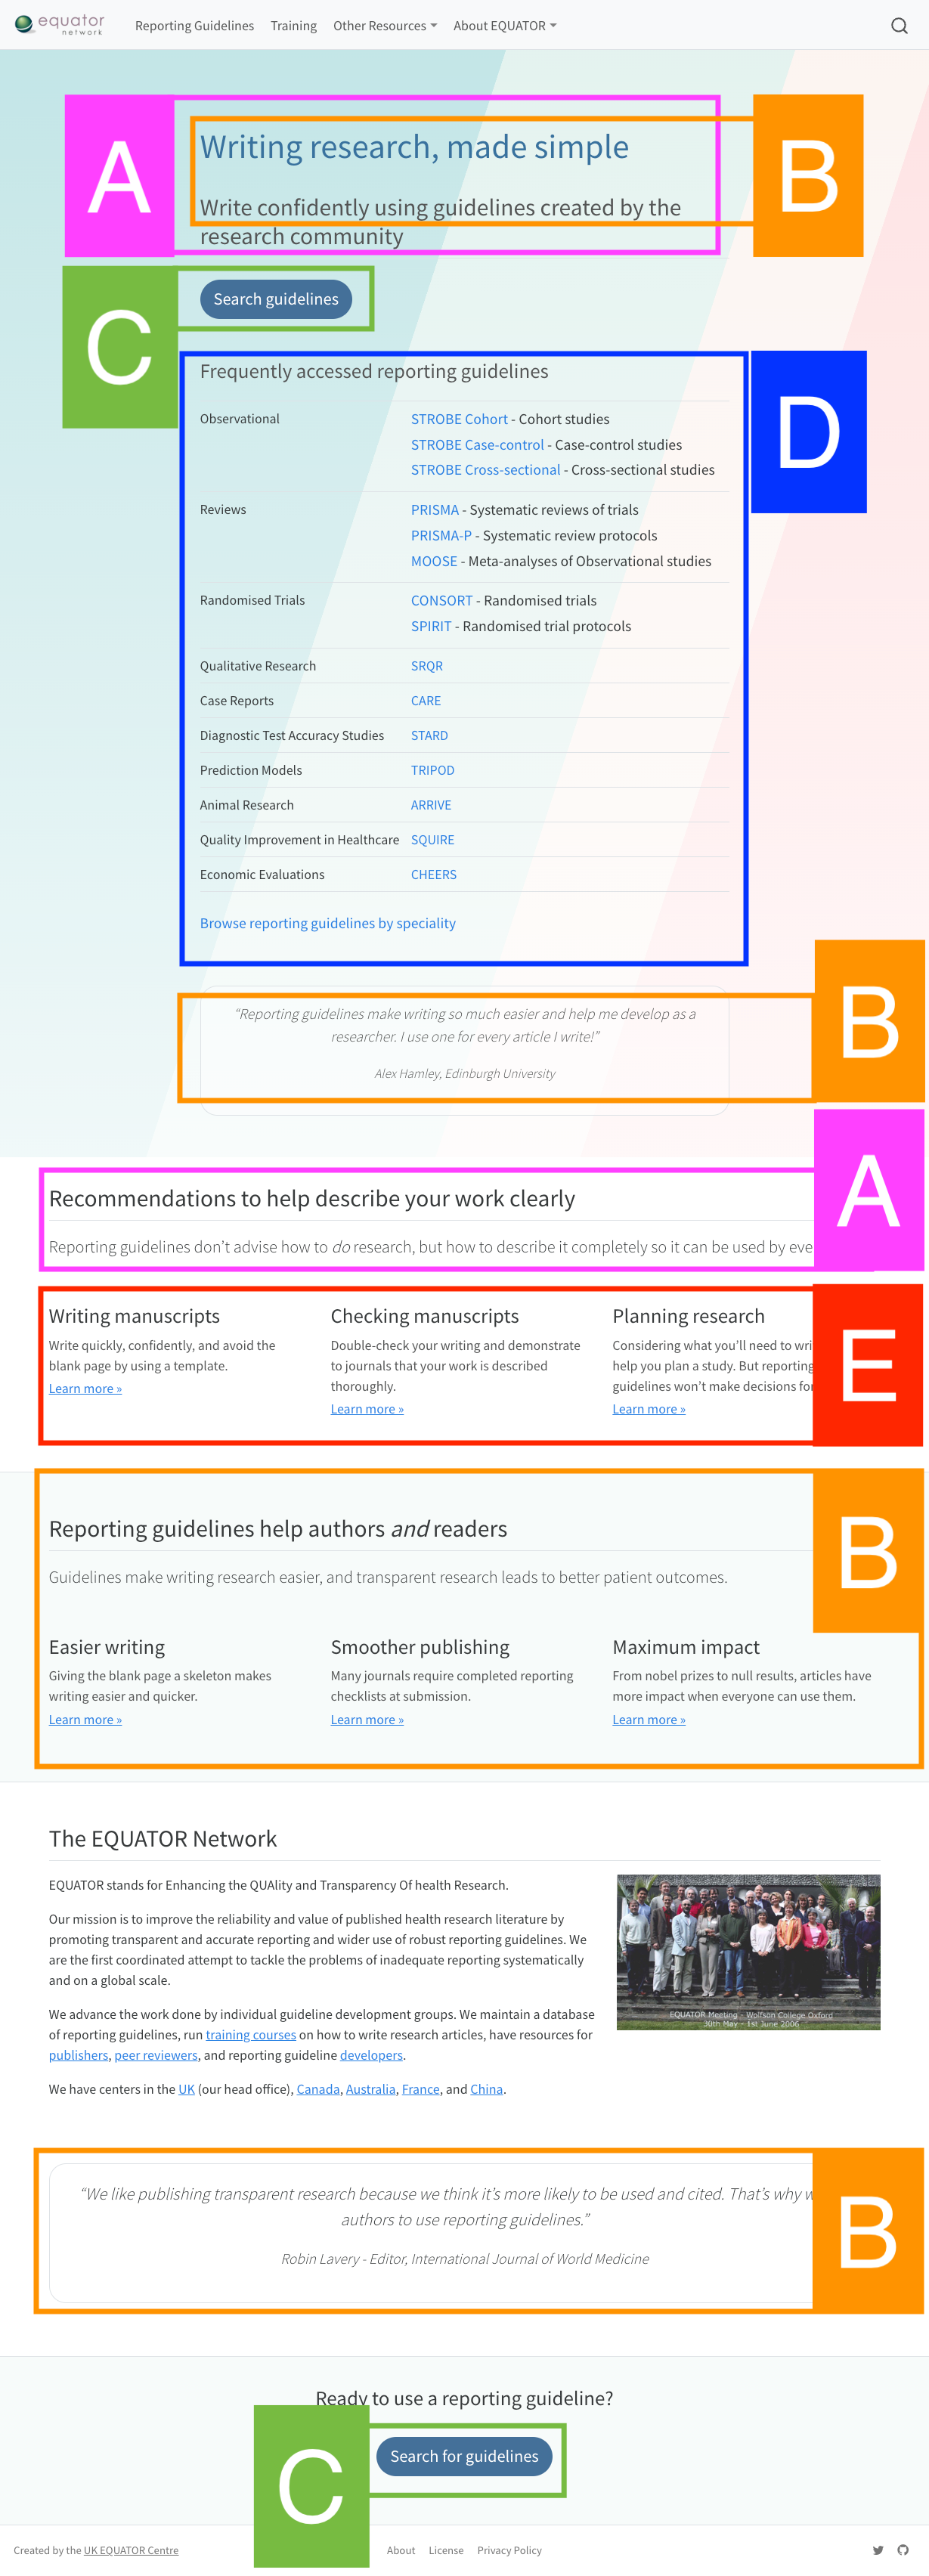
In contract, the redesigned homepage aims to minimise the proportion of authors leaving the website without engaging with reporting guidelines. The home page explains what reporting guidelines are, what writing tasks to use them for, the personal benefits they offer, and why reporting is important for reproducibility. Short quotes from authors and editors, expounding the benefits of using reporting guidelines aim to convince sceptical authors. The redesigned home page can bee seen in Figure 9.4. Intervention changes made to the homepage include:
- Reporting guidelines are now clearly defined (areas A)
- The site looks simple and has plenty of white space
- Personal benefits are described explicitly and communicated through reassuring language and quotes (see areas B)
- Search and browse buttons are easy to find (area C)
- Frequently accessed guidelines are still easy to find (area D)
- The site describes what tasks reporting guidelines can be used for, and differentiates tools by task (area E)
| INTERVENTION COMPONENT | INTERVENTION FUNCTION | BCT |
|---|---|---|
| Describe what reporting guidelines are where they are first encountered | Education | Instruction on how to perform the behavior |
| Clarify what tasks (e.g., writing, designing, or appraising research) guidelines and resources are designed for | Education | Instruction on how to perform the behavior |
| Educate authors about writing as a process | Education | Instruction on how to perform a behaviour |
| Describe personal benefits and benefits to others where reporting guidelines are introduced (home page, on resources, in communications) | Education | Information about emotional consequences, Information about others’ approval, Information about social and environmental consequences |
| Include testimonials from researchers who were nervous about being punished for reporting transparently | Persuasion | Demonstration of the behavior |
| Gather and communicate evidence for benefits | Persuasion | Information about emotional consequences, Information about others’ approval, Information about social and environmental consequences |
| Include testimonials from research users who benefit from complete reporting | Persuasion | Salience of consequence |
| Explain importance of complete reporting to the scientific community | Education | Information about social and environmental consequences |
| Tell authors when to use reporting guidelines, or that reporting guidelines are best used as early as possible | Education | Instruction on how to perform the behavior |
Introduction to the SRQR reporting guideline
Although some journals direct authors to EQUATOR’s home page, others send authors straight to EQUATOR’s database records for a particular reporting guidelines. Although EQUATOR’s database pages for each guideline do include some explanation of when the guideline should be used, and links to related guidelines and tools, this information was quite hard to find and the pages lacked many other intervention components (see Figure 9.5). Limitations of the existing database pages include:
- The actual guidance is hard to find. Area A includes 3 links. The first two send users to an article describing how SRQR was developed. The actual guidance appears in a supplement of that article, which is the third link in area A. The label “relevant URLs” is vague.
- Little instruction regarding what the reporting guideline is or can be used for other than “Qualitative research”
- Links to related guidelines that are hard to find or, as for SRQR, absent
- No metrics around how many authors use this reporting guideline (e.g., citation counts)
- The French translation of the guidance is well labelled and fairly easy to find (area B), but to the right of it is a box prominently labelled “Translations”, and the link in here would actually take the user further away from the translated guidance.
EQUATOR’s database pages direct authors to reporting guideline publications. Although these publications might include (or link to) the full guidance, most focus on lengthy descriptions of how the guidance was made and justifications of why it is needed. This is true for SRQR (see Figure 9.6). Limitations of these publications may include:
- Not all reporting guidelines describe what reporting guidelines are or what they can be used for, and these descriptions can be hard to find (areas A).
- The actual guidance or checklist may be relegated to a box, table (area B), or a linked supplement (see area C) .
- Reporting guideline publications may not reassure authors that most research has limitations, and that transparency is OK
- Publications may not be written with a reassuring tone of voice. Guideline developers often justify reporting items by emphasising the negative impact of research waste. This may be how developers justify their work to themselves, editors, reviewers, or readers. As a result, to a naïve author considering using the guidance, the tone of voice may come across as judgemental.
- Benefits to the user may be hard to find or (as with SRQR) not described at all. Benefits to others are more likely to be described, including a focus on how transparent, complete reporting benefits the research community or, conversely, how poor reporting is wasteful.
- Instruction on when reporting guidelines do/do not intend to prescribe structure, or instruction may be hard to find (see area D) or missing.
- Instructions on whether a reporting guideline intends to be a strict standard vs. ‘just’ a guideline may be hard to find (see area D) or missing.
- Links to related resources only include those that were created before the reporting guideline was published. Some guidelines don’t include any links.
- No clear instruction on whether to use the guideline in a situation that it wasn’t designed for, but when no better guidance exists.
In my redesign, I wanted authors to be able to find the full guidance directly, without having to navigate a database page or lengthy development article. However, I still wanted to include an introduction and FAQ section to help authors quickly understand what the guideline is, what it isn’t, whether it applies to them and, if it does, to convince them to use it (see Table 9.4). Because half of visitors bypass the home page and arrive directly on these guideline-specific pages, I decided to duplicate some home page components aimed at naïve authors such as basic information on what reporting guidelines, how to use them, when to use them, and why. Intervention changes included in reporting guidelines’ introductions and FAQs (shown in Figure 9.7) include:
- Clear description of what the reporting guideline is, what it can and cannot be used for, the benefits to the author and to society, and how and when it can be used. (area A)
- Description of whether the reporting guideline is intended to be a standard or ‘just’ a guideline (area A)
- Tools are clearly differentiated by task (area B)
- Related guidelines and other resources are linked. These links can be updated as and when newer guidelines are published (area C)
- Clear instruction on whether a reporting guideline can be used in a situation that it wasn’t designed for, but where no better guidance exists (area D)
- Links to translations (area E)
- Reassuring language throughout, and reassuring quotes from editors, readers, and authors (e.g., area F)
- Citation metrics (area G)
- An estimation of how long guidance will take to read (area H)
- Advice on how or where to report items so as not to breach word count limits and when reporting guidelines do or do not intend to prescribe structure (area I)
- Citation information (area K)
- Information on how the guidance was developed and why it can be trusted (area L)
| INTERVENTION COMPONENT | INTERVENTION FUNCTION | BCT |
|---|---|---|
| Instruct authors to cite reporting guidelines so readers may learn about them | Education | Instruction on how to perform the behaviour |
| Describe the scope of a reporting guideline at the top of every resource | Education | Instruction on how to perform the behaviour |
| Use if-then rules to direct authors to more appropriate and up-to-date guidance when available | Education | Instruction on how to perform the behaviour |
| Explicitly state when no better guidance exists for a use case | Education | Instruction on how to perform the behaviour |
| Provide translations | Enablement | Instruction on how to perform the behaviour |
| Tell authors how long the guidance will take to read | Education | Instruction on how to perform the behaviour |
| Explain when reporting guidelines do not intended to prescribe structure | Education | Instruction on how to perform the behaviour |
| Reassure when guidelines are just guidelines | Persuasion | Social support |
| Explain how the guidance was developed and why it can be trusted | Education | Credible source |
| Tell authors when to use reporting guidelines, or that reporting guidelines are best used as early as possible | Education | Instruction on how to perform the behaviour |
| Describe what reporting guidelines are where they are first encountered | Education | Instruction on how to perform the behaviour |
| Clarify what tasks (e.g., writing, designing, or appraising research) guidelines and resources are designed for | Education | Instruction on how to perform the behaviour |
Reporting guideline content
Reporting guidelines comprise reporting items, and an example from SRQR is in Figure 9.8. Limitations of how items are typically described include:
- Text is unstructured, so it is difficult to immediately identify what needs to be written.
- Text uses verbose, passive language
- The text appears long and difficult to digest
- Terms are not always defined
- Not all reporting items are justified
- Not all items include instruction of what to write if the item could not/was not done.
When redesigning items, although I did not change the meaning of guidance, I did give additional structure and edit phrasing. To increase clarity, I used plain language, consistent terms, and added definitions when I felt necessary. I wanted to cater to authors who read from start to finish as well as those who dip in and out, and so I created navigation menus so authors can jump to items. Intervention components applying to the entire reporting guideline content (which includes but is not limited to reporting items) appear in Table 9.5.
For each reporting item, I prioritized instructions of what to write. I placed remaining content in an expandable box, thus making the guidance appear shorter at first glance. Each expandable box includes why the reporting item is important and to whom, examples, links to related advice, and any other content that isn’t an instruction of what to write. Each item links to its own discussion channel. Two intervention components required presenting design advice separately to reporting advice, but this was not necessary as SRQR made few design assumptions or recommendations. Intervention components applying to reporting items appear in Table 9.6.
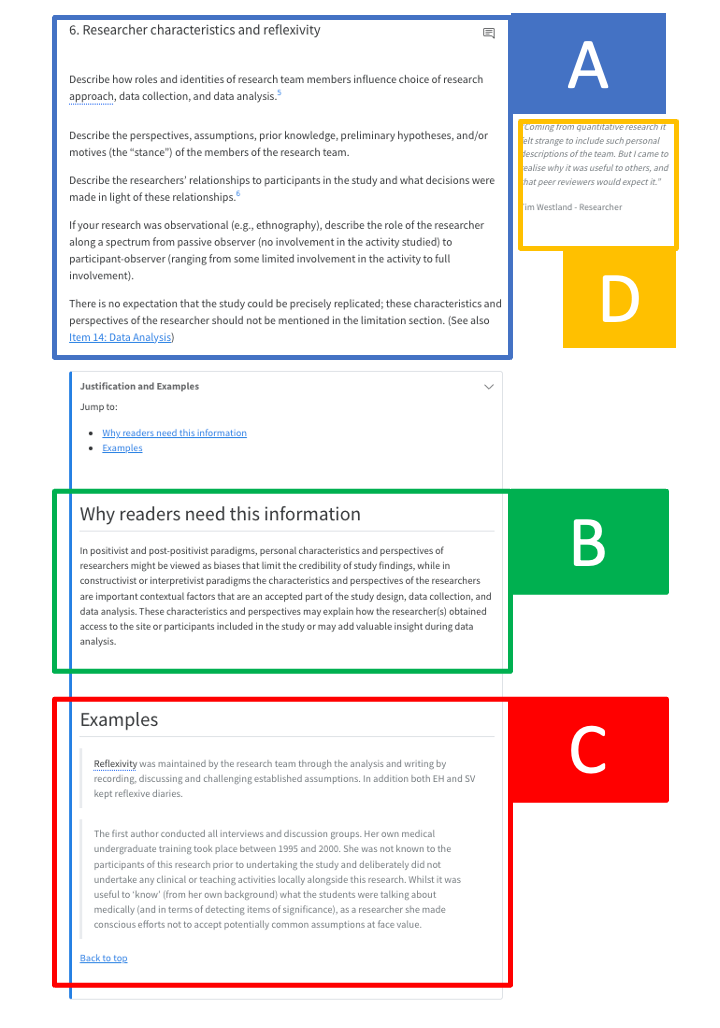
Figure 9.9 shows a redesigned reporting item. Intervention changes include:
- Content is separated into what to write (area A), why information is important (area B), examples (area C), and any additional background information (not shown).
- Areas B and C are presented as expandable content, so the only instruction immediately visible is what to write (area A). This means that the guidance is easier to digest and less intimidating.
- Definitions are presented as pop-ups for technical terms
- Quotes provide reassurance and persuasion (area D)
- Language is direct and edited for clarity and brevity
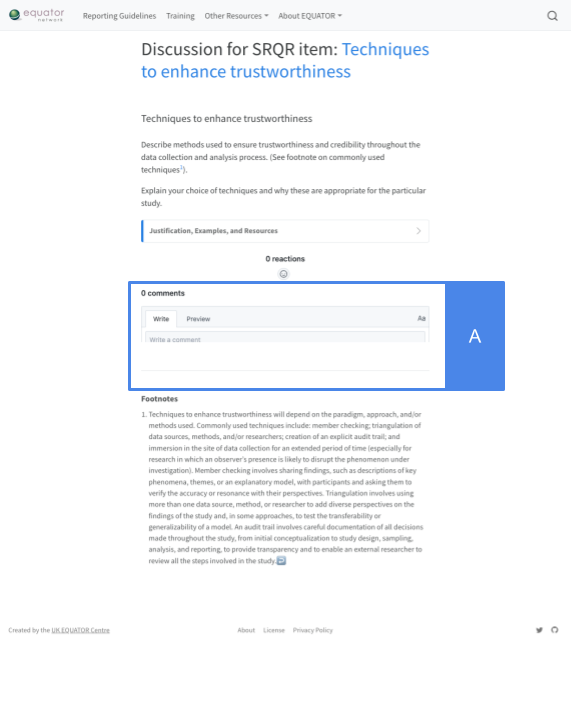
- Each item has its own discussion page (see Figure 9.10, linked to from the top right of area A)
| INTERVENTION COMPONENT | INTERVENTION FUNCTION | BCT |
|---|---|---|
| Cater to different kinds of user (readers vs dippers) by structuring guidance with headings, itemisation, hyperlinking to particular sections, and with optional content | Environmental restructuring | Restructuring the physical environment |
| Make guidance appear shorter by removing superfluous information, hiding optional content, splitting long guidelines, using concise language, and separating design advice | Environmental restructuring | Restructuring the physical environment |
| Decrease fear of judgement by making reporting guidelines design agnostic | Coercion (Removal of) | Remove aversive stimulus |
| Present design advice separately to reporting advice | Coercion (removal of) | Restructuring the physical environment |
| Use plain language | Enablement | Instruction on how to perform the behaviour |
| Define key terms | Education | Instruction on how to perform the behaviour |
| Use consistent terms | Enablement | Instruction on how to perform the behaviour |
| Educate authors about writing as a process | Education | Instruction on how to perform a behaviour |
| Describe personal benefits and benefits to others where reporting guidelines are introduced (home page, on resources, in communications) | Education | Information about emotional consequences, Information about others’ approval, Information about social and environmental consequences |
| Include testimonials from research users who benefit from complete reporting | Persuasion | Salience of consequence |
| Include testimonials from researchers who were nervous about being punished for reporting transparently | Persuasion | Demonstration of behaviour |
| Gather and communicate evidence for benefits | Persuasion | Information about emotional consequences, Information about others’ approval, Information about social and environmental consequences |
| INTERVENTION COMPONENT | INTERVENTION FUNCTION | BCT |
|---|---|---|
| Structure guideline items to make them quicker to digest | Enablement | Restructuring the physical environment |
| For each item, explain why the information is important and to whom (not just what constitutes “good” design) | Education | Information about social and environmental consequences |
| Provide links to other resources that explain how an item can be done | Education | Instruction on how to perform the behaviour |
| For each item, provide clear instruction of what needs to be described | Education | Instruction on how to perform the behaviour |
| For each item, provide examples of reporting in different contexts | Modelling | Demonstration of the behaviour |
| Create spaces for authors to discuss reporting guidelines with others | Persuasion | Social comparison, Credible source, Adding objects to the environment |
| Provide clear instruction of what needs to be described when an item was not done, could not be done, or does not apply | Education | Instruction on how to perform the behaviour |
| Provide instruction as to how and where information can be reported without breaching word count limits or making articles bloated. | Education | Instruction on how to perform the behaviour |
| Encourage explanation even when choices are unusual or not optimal | Education | Instruction on how to perform the behaviour |
FAQ
At the end of the guideline, an FAQ section includes information that was too lengthy to be fully discussed in the page’s introduction (see Table 9.7). This includes a longer description of how the guideline’s development (and link to the original publication), citation instruction, and advice on how to respond if an editor or co-worker asks you to remove guideline content.
| INTERVENTION COMPONENT | INTERVENTION FUNCTION | BCT |
|---|---|---|
| Provide advice regarding how to respond if asked to remove reporting guideline content by a colleague, editor, or reviewer | Education | Problem solving |
| Explain how the guidance was developed and why it can be trusted | Education | Credible source |
System architecture
EQUATOR’s existing website is built using Wordpress. Although EQUATOR staff can make basic content modifications using a content managing system, they rely on software developers for more significant alterations. I considered Wordpress and other DIY website builders (like Wix [20] or Squarespace [21]) but decided against them. Most come with expensive monthly subscriptions. Most offer a ‘drag and drop’ building experience which, although easy to use, is a laborious way of uploading and formatting large amounts of content. Should EQUATOR want to change how reporting items are presented (for example, reposition examples), they would have to manually edit every item for every reporting guideline. Additionally, many intended intervention changes required functionality not offered by these services (e.g., popup glossary definitions, discussion boards).
Creating a custom coded website also felt unacceptable. Html and javascript are two languages commonly used for creating websites. Although many software developers will be fluent in them, few early career researchers are, and fewer still would have the necessary experience to maintain databases or web servers.
I noticed that researchers are increasingly writing reproducible manuscripts using markdown, and therein lay a compromise that promised the functionality we needed without technical expertise. Markdown is a simple language and takes minutes to learn. It uses asterisks, underscores, and carets to make text **bold**, _italic_, or ^superscript^. Headings, URLS, and references are similarly easy, and free editing software makes writing markdown feel like writing a Microsoft Word document. Markdown converts into lots of other formats, including docx (Microsoft Word files), LaTeX, PDF, and HTML.
Many researchers already use tools like RStudio [22] or Quarto [23] to convert markdown into other formats. I decided to use Quarto because it is open source, has great documentation, and its functionality can be extended with other programming languages commonly used by researchers and statisticians, like Python or Ruby. Quarto takes plain text (markdown) and converts it into a web page. Academics who write using Quarto or R Studio will be familiar with the idea of “knitting” documents together: taking text with data, figures, analyses, and references, all saved as separate files, and compiling them into a single, publication-ready manuscript. The process of creating a web page is similar. I’ve created a platform that takes a guideline, stored as plain text across multiple files, and converts it into an interactive web page. These guideline files include reporting items, a glossary, meta data, introductory information, and FAQ information.
Quarto websites do not require a database or a server. This means they are free to host, easy to maintain, and have fewer data security concerns. Because all reporting guideline content is saved as plain text files, these files can be version controlled on Github, an industry-leading version control system commonly used by academics, and each version can be cited. This means guideline developers will be able to release incremental updates (e.g., to clarify the wording of a reporting item) and authors will be able to cite the exact version of the guidance they used.
I’ve made all code available on Github [24]. I’ve used Github Pages [25] to host the website because it is free, secure, beginner friendly, configurable, and integrates seamlessly with Github’s version control system.
9.4 Discussion
The aims of this chapter were to create an intervention component table by drawing on the results of all previous chapters, and to turn these components into a prototype ready to test amongst authors. The intervention component table brings together the outputs of all of my previous thesis chapters and links them together; each component comes from an idea (chapter 8), and addresses one or more influences and behavioural drivers (chapters 3 - 5) using intervention options ranked favourably by EQUATOR staff (chapter 7). My design process relied on this table and I used it again in my next chapter as an analysis framework. Hence this table, although relegated to the appendix because of its size, is a focal point for my thesis: it crystallises all preceding chapters, and formed the basis for all of my subsequent work.
The table includes components derived from all ideas pursuant to the intervention options EQUATOR staff and I prioritised in our workshops. Because I filtered out ideas not in line with our priorities, the list is not exhaustive. Stakeholders using the same set of initial ideas would create different components because of their different priorities and implementation opportunities. For example, a funder may have generated more components related to reporting guidance for applications or protocols, or relating to their application criteria and submission systems. Stakeholders with the power to grant approval (for funding/ethics/publication) may have components related to enforcement or reward. Consequently, although I hope my list will help readers understand the intervention changes I have made and why I have made them, I would encourage other intervention designers to go through this process themselves instead of using this list verbatim.
Throughout the intervention component table I have drawn comparisons between the proposed components and existing reality. Sometimes these comparisons are vague; I use terms like “some” or “rarely”. Where possible, I refer to images or examples. Some examples came from my qualitative synthesis (chapter 3), others arose organically in my workshops (chapter 7) when participants shared long-standing frustrations with reporting guidelines or EQUATOR’s website. Other times, after discussing a barrier or idea, we would look at a few guidelines to see how things are done currently. So my comparisons were ad-hoc, and I have included them only to provide context to the proposed changes. I considered making this comparison formal by systematically coding BCTs employed by EQUATOR’s website and popular guidelines. Ultimately, I decided this would not be helpful nor practical. With so many components and so many guidelines, this would have taken too long. Secondly, I doubted this audit would influence my subsequent design, but would merely quantify how my redesigned intervention differs to the current set-up. Should a quantifiable comparison be useful, it would be more appropriate to do it after the redesigned intervention has been refined in response to user feedback, once its design is stabilised.
Using this intervention component table I have created functional prototypes of a redesigned reporting guidelines and the EQUATOR Network home page. These new designs include 46 of the 62 intervention components I identified.
Using a framework and a systematic method helped the design advisory panel and I to make decisions based on evidence and theory, and to reduce the influence of our own subjectivity. Instead of relying on personal preference, we tried to ensure choices reflected the function we were trying to employ. For example, when choosing a background image, instead of asking “do you like this one?”, the questions became “what feelings do you think this image conveys? Does it communicate simplicity?”. Reflection was also useful when exploring disagreements between panel members. For example, when sketching layouts for the home page, some panel members drew a single, prominent search button. Others drew a plethora of options like “view guidelines by speciality”, “view guidelines A-Z”. Discussion revealed that whereas some staff prefer to search directly for what they want with laser-like focus, others prefer to explore, especially when they are not certain what they want or what the website is about. In this instance, the final design takes both use cases into account, but other times we resolved disagreement by referring to the intervention planning table or to similar websites. Hence using a framework and exploring disagreements as a group helped mitigate personal preferences.
However, many decisions required a degree of subjectivity and, as lead researcher, designer, and developer, often these decisions landed on my shoulders. I tried to mitigate this by prioritizing other people’s ideas over my own, and providing many opportunities for feedback. But the result undeniably has my “stamp”. If someone else had built it using the same table of intervention components then some things might be the same (like simplifying the user journey from 5 steps to 2, or the conventional home page layout and search button position) but other things would look different (like the choice of wording and images).
My design may have benefited from input from other stakeholders. I describe how I obtained feedback from authors in my next chapter, but I would have liked to include authors, publishers, funders, and other stakeholders from the start of the design process. If EQUATOR decide to take my designs forward, these consultations could still take place, but they were not feasible within the time constraints of my PhD.
Input from user experience experts and graphic designers would also be useful. We found images to be a time consuming pain point. None of us had the skills to create professional looking graphics ourselves, and we found most free stock images were generic and did not communicate what we needed.
My experience of working with SRQR’s lead developer, Bridget, was was positive; she was supportive, liked the result, and she was interested when my process revealed gaps in SRQR item description. For example, often there was no guidance of what to write if a reporting item was not or could not be done. Some items did not explain why they are important and to whom. Filling these blanks required time and input that SRQR’s development team were unable to give at present, and so I left these gaps unfilled for now. I anticipate other guidelines will have similar gaps. I hope other guideline developers will be as open-minded as Bridget was, but I expect others may feel less able or motivated to engage with a redesign, or may feel protective over their writing and resistant to change.
In addition to filling these gaps, making my redesign “live” would require further technical work. Some of these tasks are administrative and have no behaviour change impact, but there are still 16 intervention components outstanding. These components were too difficult or time consuming to include at this stage. For example, I intended to include more examples of reporting items, including examples of concise reporting or transparently reported “imperfect” items. EQUATOR could add these intervention components at a later date. Other components may require significant design and development work, most notably creating ready-to-use checklists and templates.
If EQUATOR chooses to adopt these changes and apply them to other guidelines, hundreds of thousands of authors would access these redesigned resources each year. These redesigned resources have potential to benefit authors directly, and also to help other stakeholders. For example, publishers may find enforcing guidelines easier if my redesigned resources prove more user friendly. Guideline developers will benefit from having a ready-to-use dissemination platform based on evidence, with built-in channels for collecting feedback from authors. This feedback may help guideline developers refine their resources further, and could act as evidence to support future funding applications.
Conclusions
By linking components with barriers, functions, and behaviour change techniques, I have justified components using evidence and described how they are theorized to work. This table will help other intervention developers and stakeholders understand what changes I have made and why. It also helped me redesign the EQUATOR Network’s home page and the SRQR guideline. These new designs include 46 of the 62 intervention components I identified, and many of the remainder could be added later. Although my designs may have benefited from including other stakeholders, I explained how I facilitated open discussion, prioritised other’s opinions, and used my intervention component table to make decisions. In the next chapter I explain how I refined these designs further by interviewing and observing authors.
9.5 Reflections on this chapter
This was the hardest chapter to write. Initially I included it in my focus groups chapter, then I split it apart into separate chapters for defining intervention components and developing the intervention which I subsequently rejoined. I found writing difficult because the chapter did not obviously fit into a traditional research package. I had objectives, but no research questions. I had an approach and outcomes, but they didn’t feel like methods and results and when my approach was iterative it felt difficult to force it into a linear narrative. There were no reporting guidelines to help me and so instead I turned to the internet to seek general advice for structuring and writing academic text. I landed on Rachael Cayley’s blog, Explorations of Style [26] and Helen Sword’s book Stylish Academic Writing [27]. In particular, I found Rachael’s description of Reverse Outlines as a technique for unpicking and restructuring messy text useful for revising this chapter. Reading these made me realise how little I knew about writing as an art and as a skill. I’ve never enjoyed writing but I had always thought I it was skill I had ticked and would never forget. But reading Rachael’s blog and Helen’s book made me realise how little I knew and how much I had forgotten since my only formal writing training in GCSE English 20 years ago! I’d forgotten the nuts and bolts of structuring arguments, paragraphs, or sentences. I’d forgotten the heuristics of clear writing, and developed an unhealthy reliance on passive verbs and relative clauses. When writing my early chapters I tried using a reporting guideline as a skeleton and I then filled in the blanks. I made no outlines, no structural scaffold beyond the guideline. Because I had no reporting guideline for this chapter I had lost my crutch, and my inexperience in structuring writing became apparent.
This realisation was interesting to me as it revealed barriers beyond reporting guidelines. If readers cannot understand my work it’s probably not just because I failed to adhere to a reporting guideline, but also because I’m an inexperienced writer and my writing can be clunky and imprecise. When workshop members talked about educating authors about writing as a skill (chapter 7) the idea did not resonate with me until now, and I realise that the website I’ve created contains only superficial advice about writing in general. If I had reflected on my own struggles with writing before making it, perhaps I would have tried harder to address this problem in the redesign. That I am already reconsidering design choices points to two further realisations. Firstly, it’s a reminder of the subjectivity that is inevitably part of any design process, despite my efforts to remain systematic and objective. Secondly, it reveals my hope that the website will be improved in response to evolving needs, context, evidence, and understanding, ideally derived from user feedback, which is the subject of my next chapter.